Part 2 of 4 – In this post, I discuss the value of Bitcoin as well as how the economy works.
Note -
This four part series on Bitcoin is based off of my Legal Issues in Technology (LAW370) final. I wanted to take parts of my final paper and write about them here on a more casual platform that allowed me to devolve on some of the topics and go on some tangents. This four part blog also fits perfectly into the last month before holiday break! I hope readers can enjoy this and learn a little bit about Bitcoin. It is definitely a strange story to tell.
Inflation Control
Bitcoin comes "out of thin air" from mining, so what is stopping the creation of so many bitcoin that they become worthless? Nakamoto was forward thinking enough to see this issue and establish how many bitcoin there would be created and the limit of existing bitcoin.
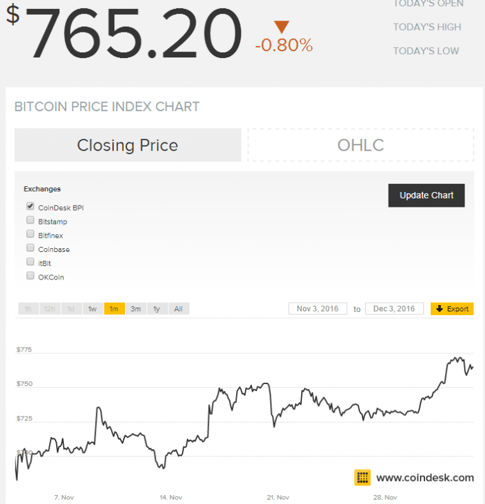
In order to control inflation and the value of “bits” in the economy, Bitcoin has a finite amount of coins. The value of coins changes over time, and it is more common to own and spend “bits” of a coin rather than a whole coin. The value of a coin has gotten up to 1,000.00 USD and as low as 200.00 USD. As of November 2016, the price of one Bitcoin is about 760.00 USD (Coindesk, 2016).
Bitcoin Limits
Bitcoin (BTC) increases at a block rate (12.5 BTC/block) of one block every ten minutes until 2020. Following, the block rate will halve to 6.25 BTC per block every ten minutes, and every four years the amount of bitcoin per block will halve until the year 2110 creating a finite 21 million bitcoin in the economy (Nakamoto, 2009).
I've created a few graphs to show the growth, creation, and total of Bitcoin between the years 2008 to 2040. You'll see it is very symmetrical and approaches the 21 Million limit very closely in 2040. It is not going to be a clean limit of 21,000,000 – more like 20,999,999.something. This is because the 4-byte single-precision float data type support only up to seven decimals and, due to rounding, will not reach a clean 21 million.
Growth
Growth V. Years
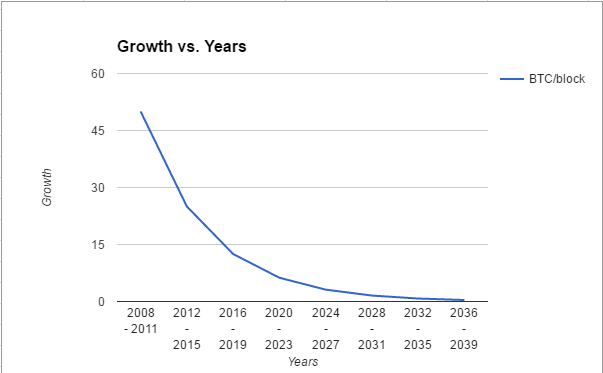
Here we are seeing a simple halving each 4 year period. The block rate in 2008 – 2011 was 50 BTC/block growing every ten minutes. As of this posting in December of 2016, we've now completed the first 1/4 period of 12.5 BTC/block rate. The graph also shows that by the end of 2039, the growth of bitcoin will be a tiny 0.390625 BTC/block and signaling a closing of the 21 million limit gap within a few years.
Created and Total
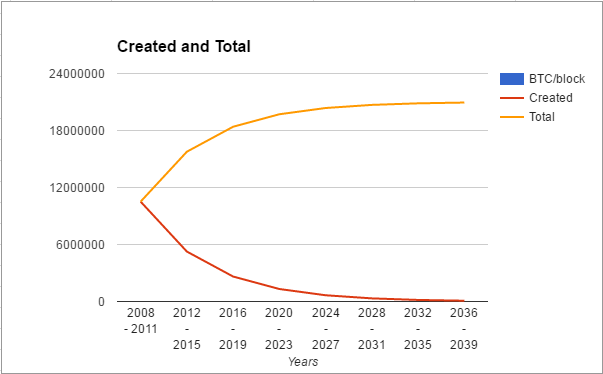
Similar looking to Growth V. Years, the Created and Total shows the productivity in the market. The lines look mirrored as a result of the uniform and symmetrical system set up. By 2012, the total number of bitcoin in the ecosystem was 10,512,000 BTC – the exact number created in the first four years because there was no halving yet. Each four years, the trend shows that half of the previous time period and an exponentially declining total of bitcoin being put into the ecosystem.
Growth
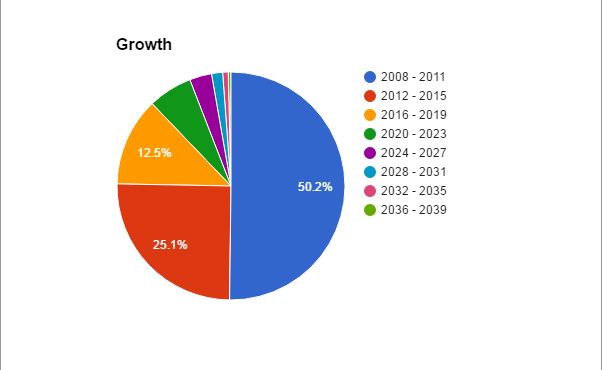
This last pie chart just represents how much of the bitcoin economy was created in each period of time. Within the first four years half of all bitcoin ever going to be produced were produced. We're currently looking at more than 75.3% of all bitcoin already created.
Next week I will break down exactly how mining works, the purpose of mining, and why people are buying shelve-loads of computers to mine as many as they can.
Sources:
CoinDesk (2016). Bitcoin Price Index.
Nakamoto, Satoshi (31 October 2008). Bitcoin v0.1 released.